
Economics, Current Events
Hours Worked and Productivity
The Economist ran an article recently called “Get a Life”. It argues that there tends to be higher worker productivity in countries where people work fewer hours. Excerpt:
And it seems that more productive—and, consequently, better-paid—workers put in less time in at the office. The graph below shows the relationship between productivity (GDP per hour worked) and annual working hours:
The Greeks are some of the most hardworking in the OECD, putting in over 2,000 hours a year on average. Germans, on the other hand, are comparative slackers, working about 1,400 hours each year. But German productivity is about 70% higher.
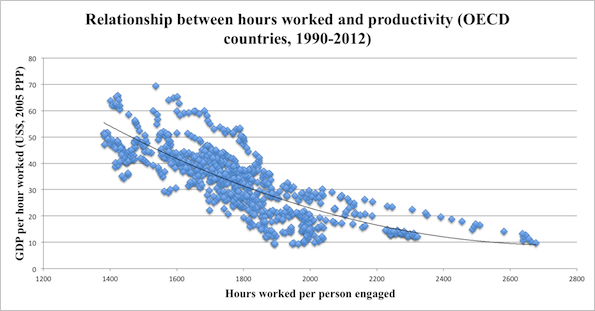
Call the graph above Fig 1.
I found this article rather bizarre.
Look, there’s an interesting question about what the optimal number of hours of work are from a productivity standpoint. But this kind of graph doesn’t tell us much. The reason is that it looks to be little more than a non-standard way of showing that inputs have diminishing marginal returns. For any given input, the first, say, 10 units of it typically have more value than the next 10, which have more value than the next 10, and so on. I grabbed this graph off the Internet:
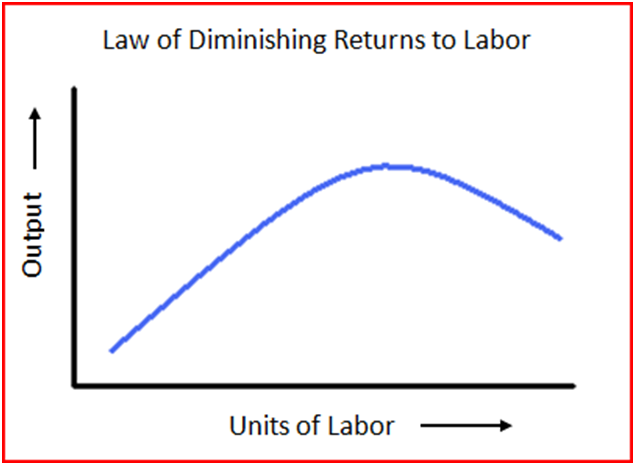
The numbers don’t really matter here. What matters is the shape. For any given worker, on average, the first 10 hours of his labor will be worth more (will be more productive) than the next 10 hours, etc. At some point, additional hours will bring a negative marginal return. (If you never sleep, you won’t produce good work, and so your work will at some point be worth less than your pay.)
So, it’s to be expected from the second week of ECON 101 that, all things equal, the average productivity per hour of workers who work long hours will be lower than that of workers who work high hours.
Back to Fig. 1. If we plotted something like “average utility of cookies consumed” against “numbers of cookies consumed,” with each dot representing a particular person, we’d get a figure much like figure 1.